
This case study is for adults only.
It shows work for nicotine products and is intended for people aged 18 or over.
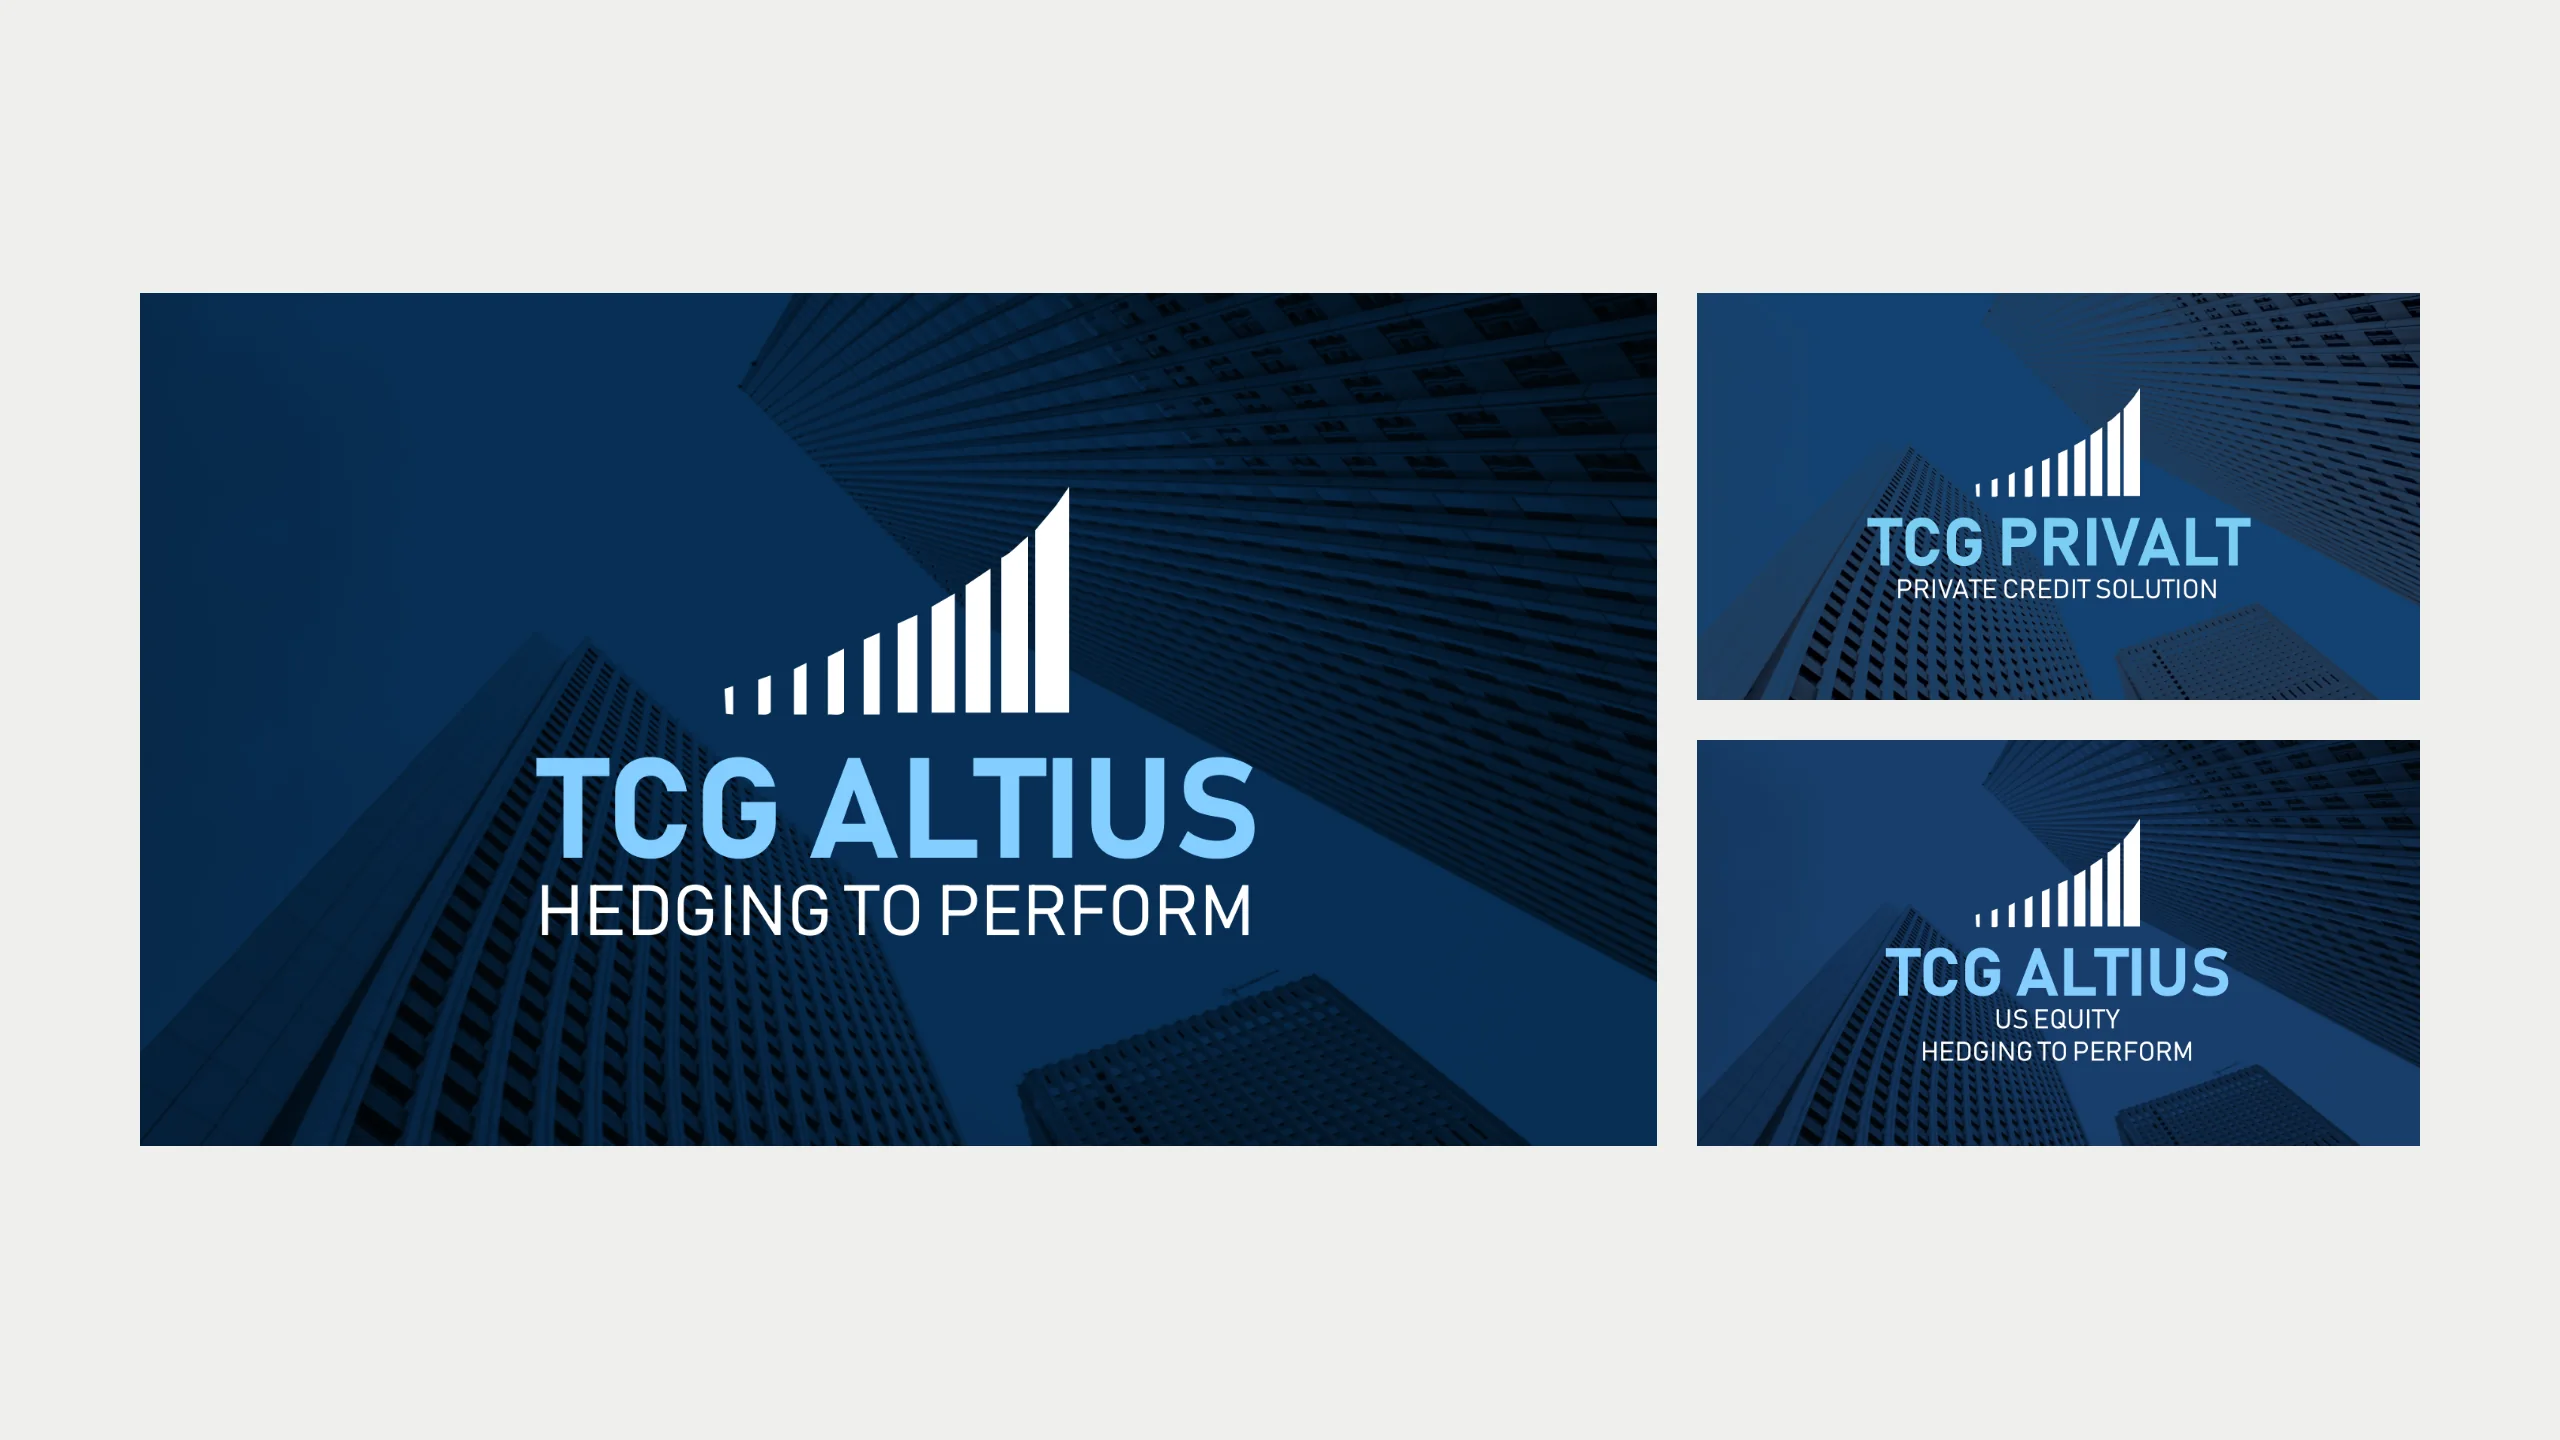
Trajectoire Capital Group
Presentations
Investor decks that look as rigorous as the strategies they present.
A year of investor presentations for Trajectoire Capital Group: client drafts turned into one deck system with clear charts and distribution-ready versions.
The challenge
Trajectoire Capital Group, an asset manager serving professional and institutional investors, needed its strategy presentations to look as rigorous as the strategies themselves. Content changed constantly: performance tables, risk charts and legal wording were updated round after round, often in the client's own PowerPoint drafts.
The insight
In finance, design earns trust by being invisible: one grid, one typeface family, and charts that make a comparison obvious at a glance.
The approach
Our presentation designers built a single system for all the firm's decks, a condensed type family, architectural photography and a fixed chart language, and then ran every update through it. Each round came in as a client draft and went out as a designed deck, with every new data set redrawn into the same visual language, plus compressed versions for email distribution.
The project
A year of investor presentations for Trajectoire Capital Group: client drafts turned into one deck system with clear charts and distribution-ready versions.
What we delivered
- Flagship strategy presentation
- Second product presentation, strategy and AMC versions
- Short presentations for first meetings
- Redrawn performance charts and comparison tables
- Full and compressed distribution versions
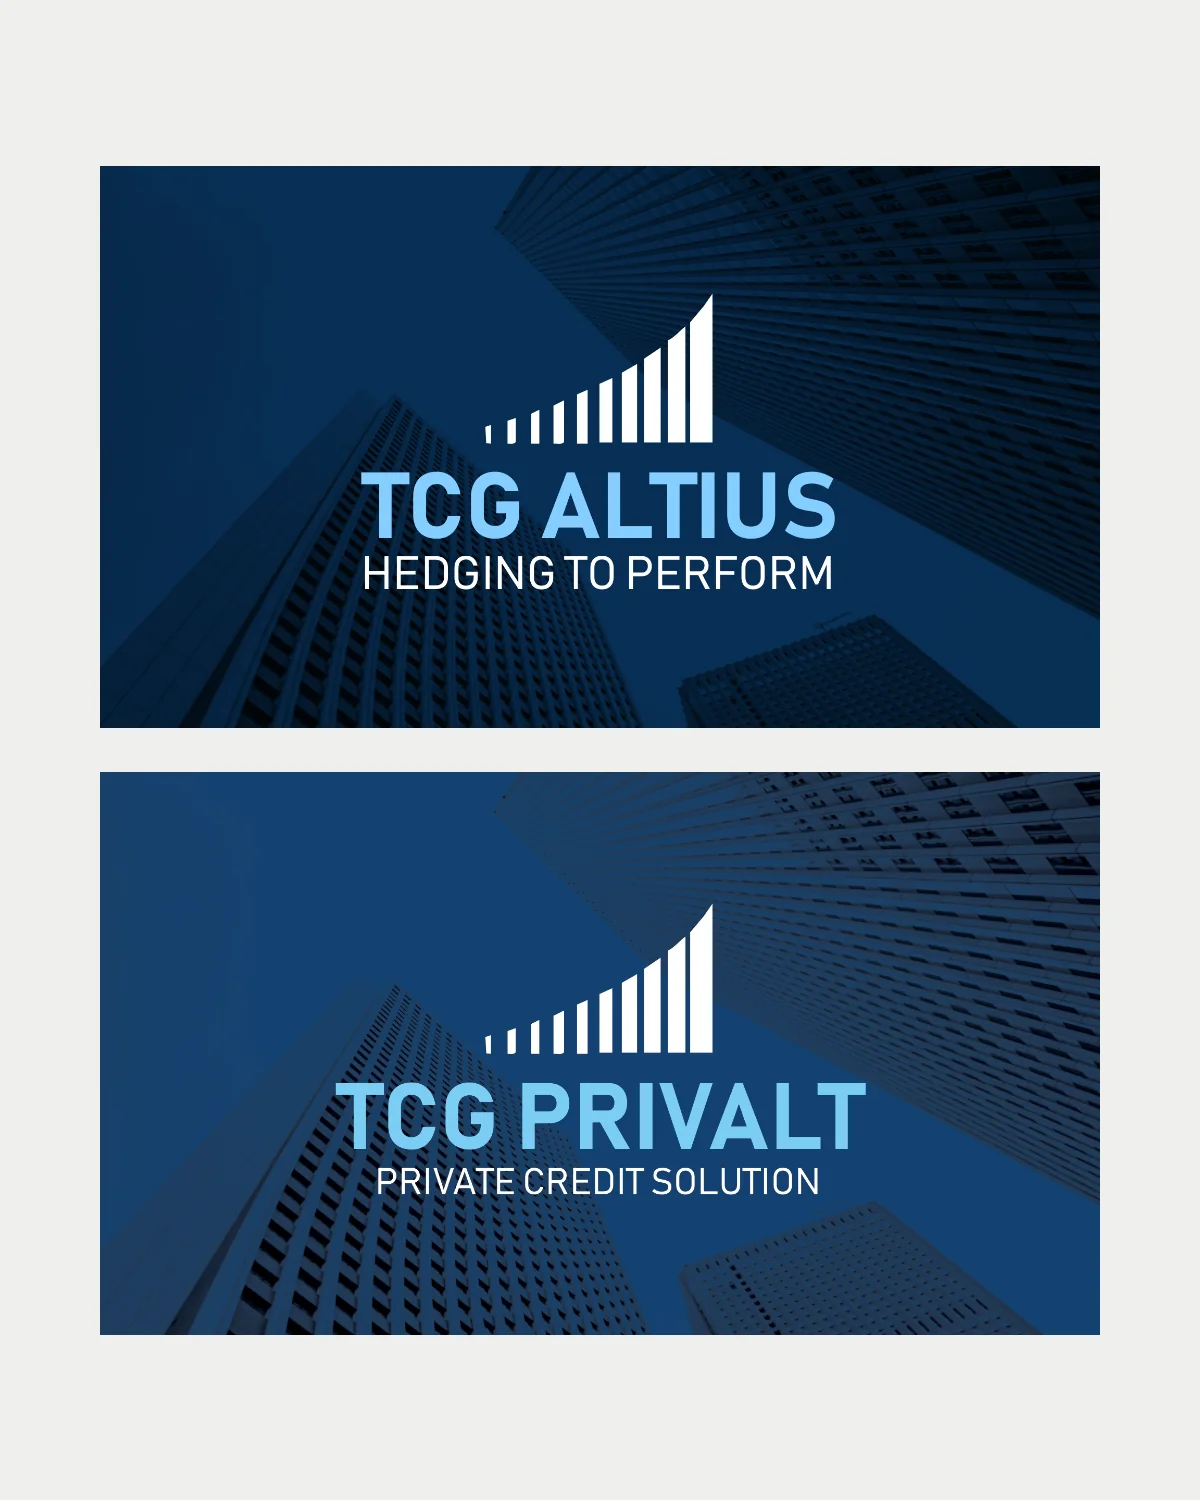
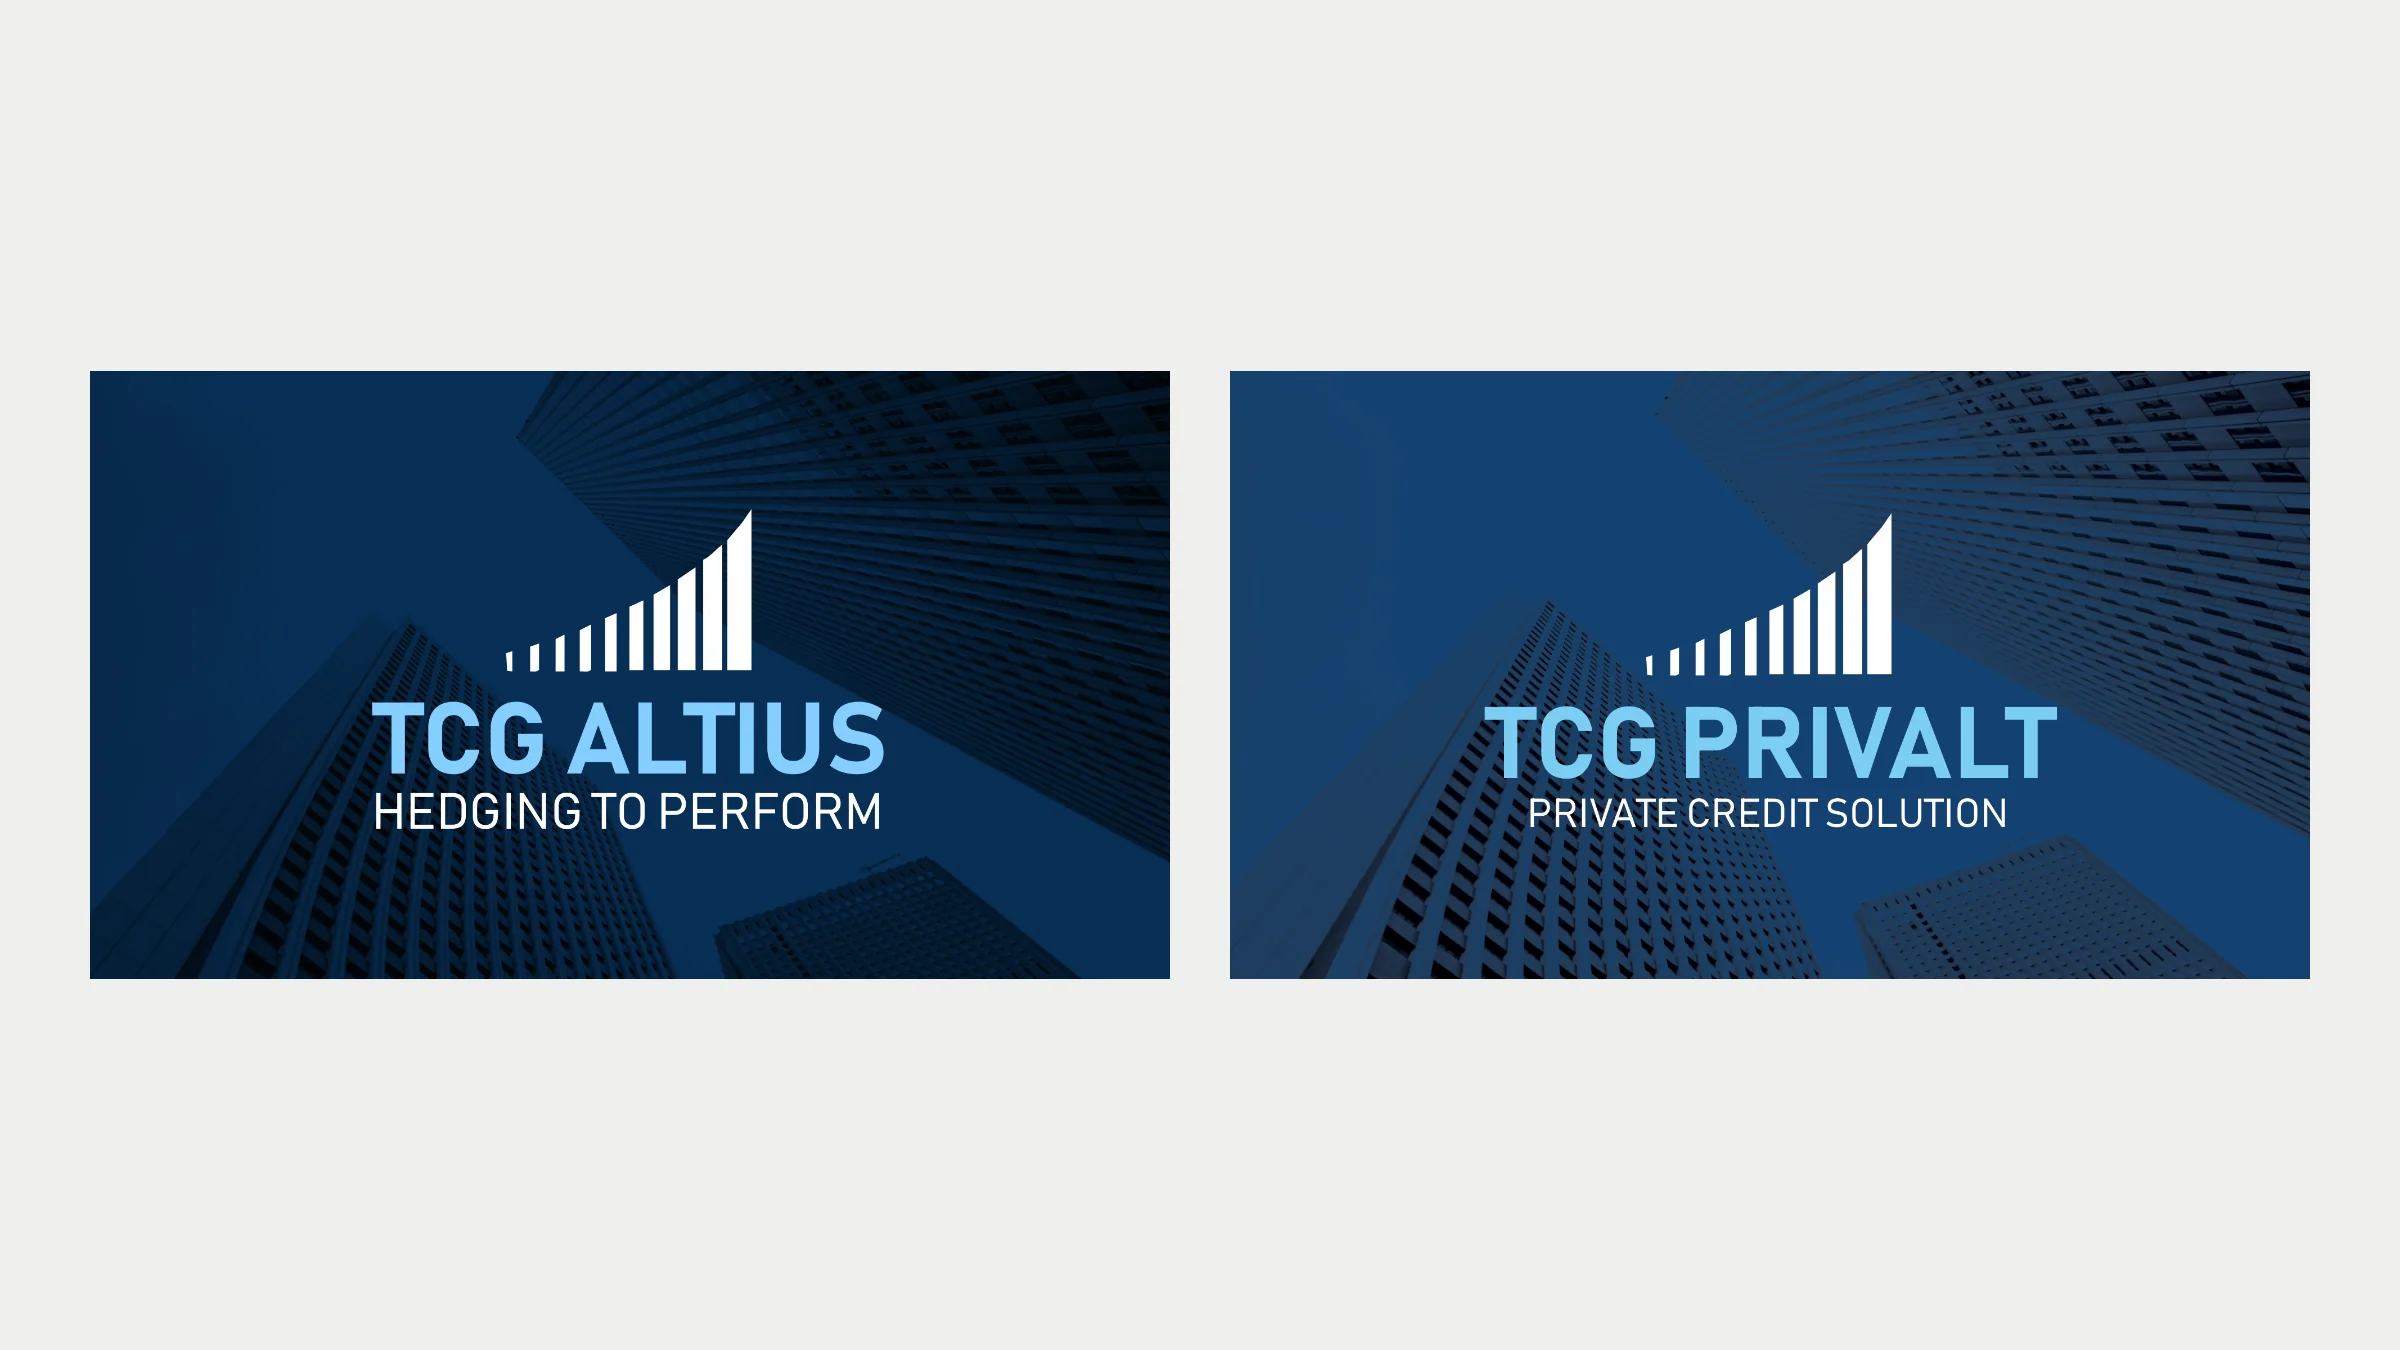
Design — One deck system
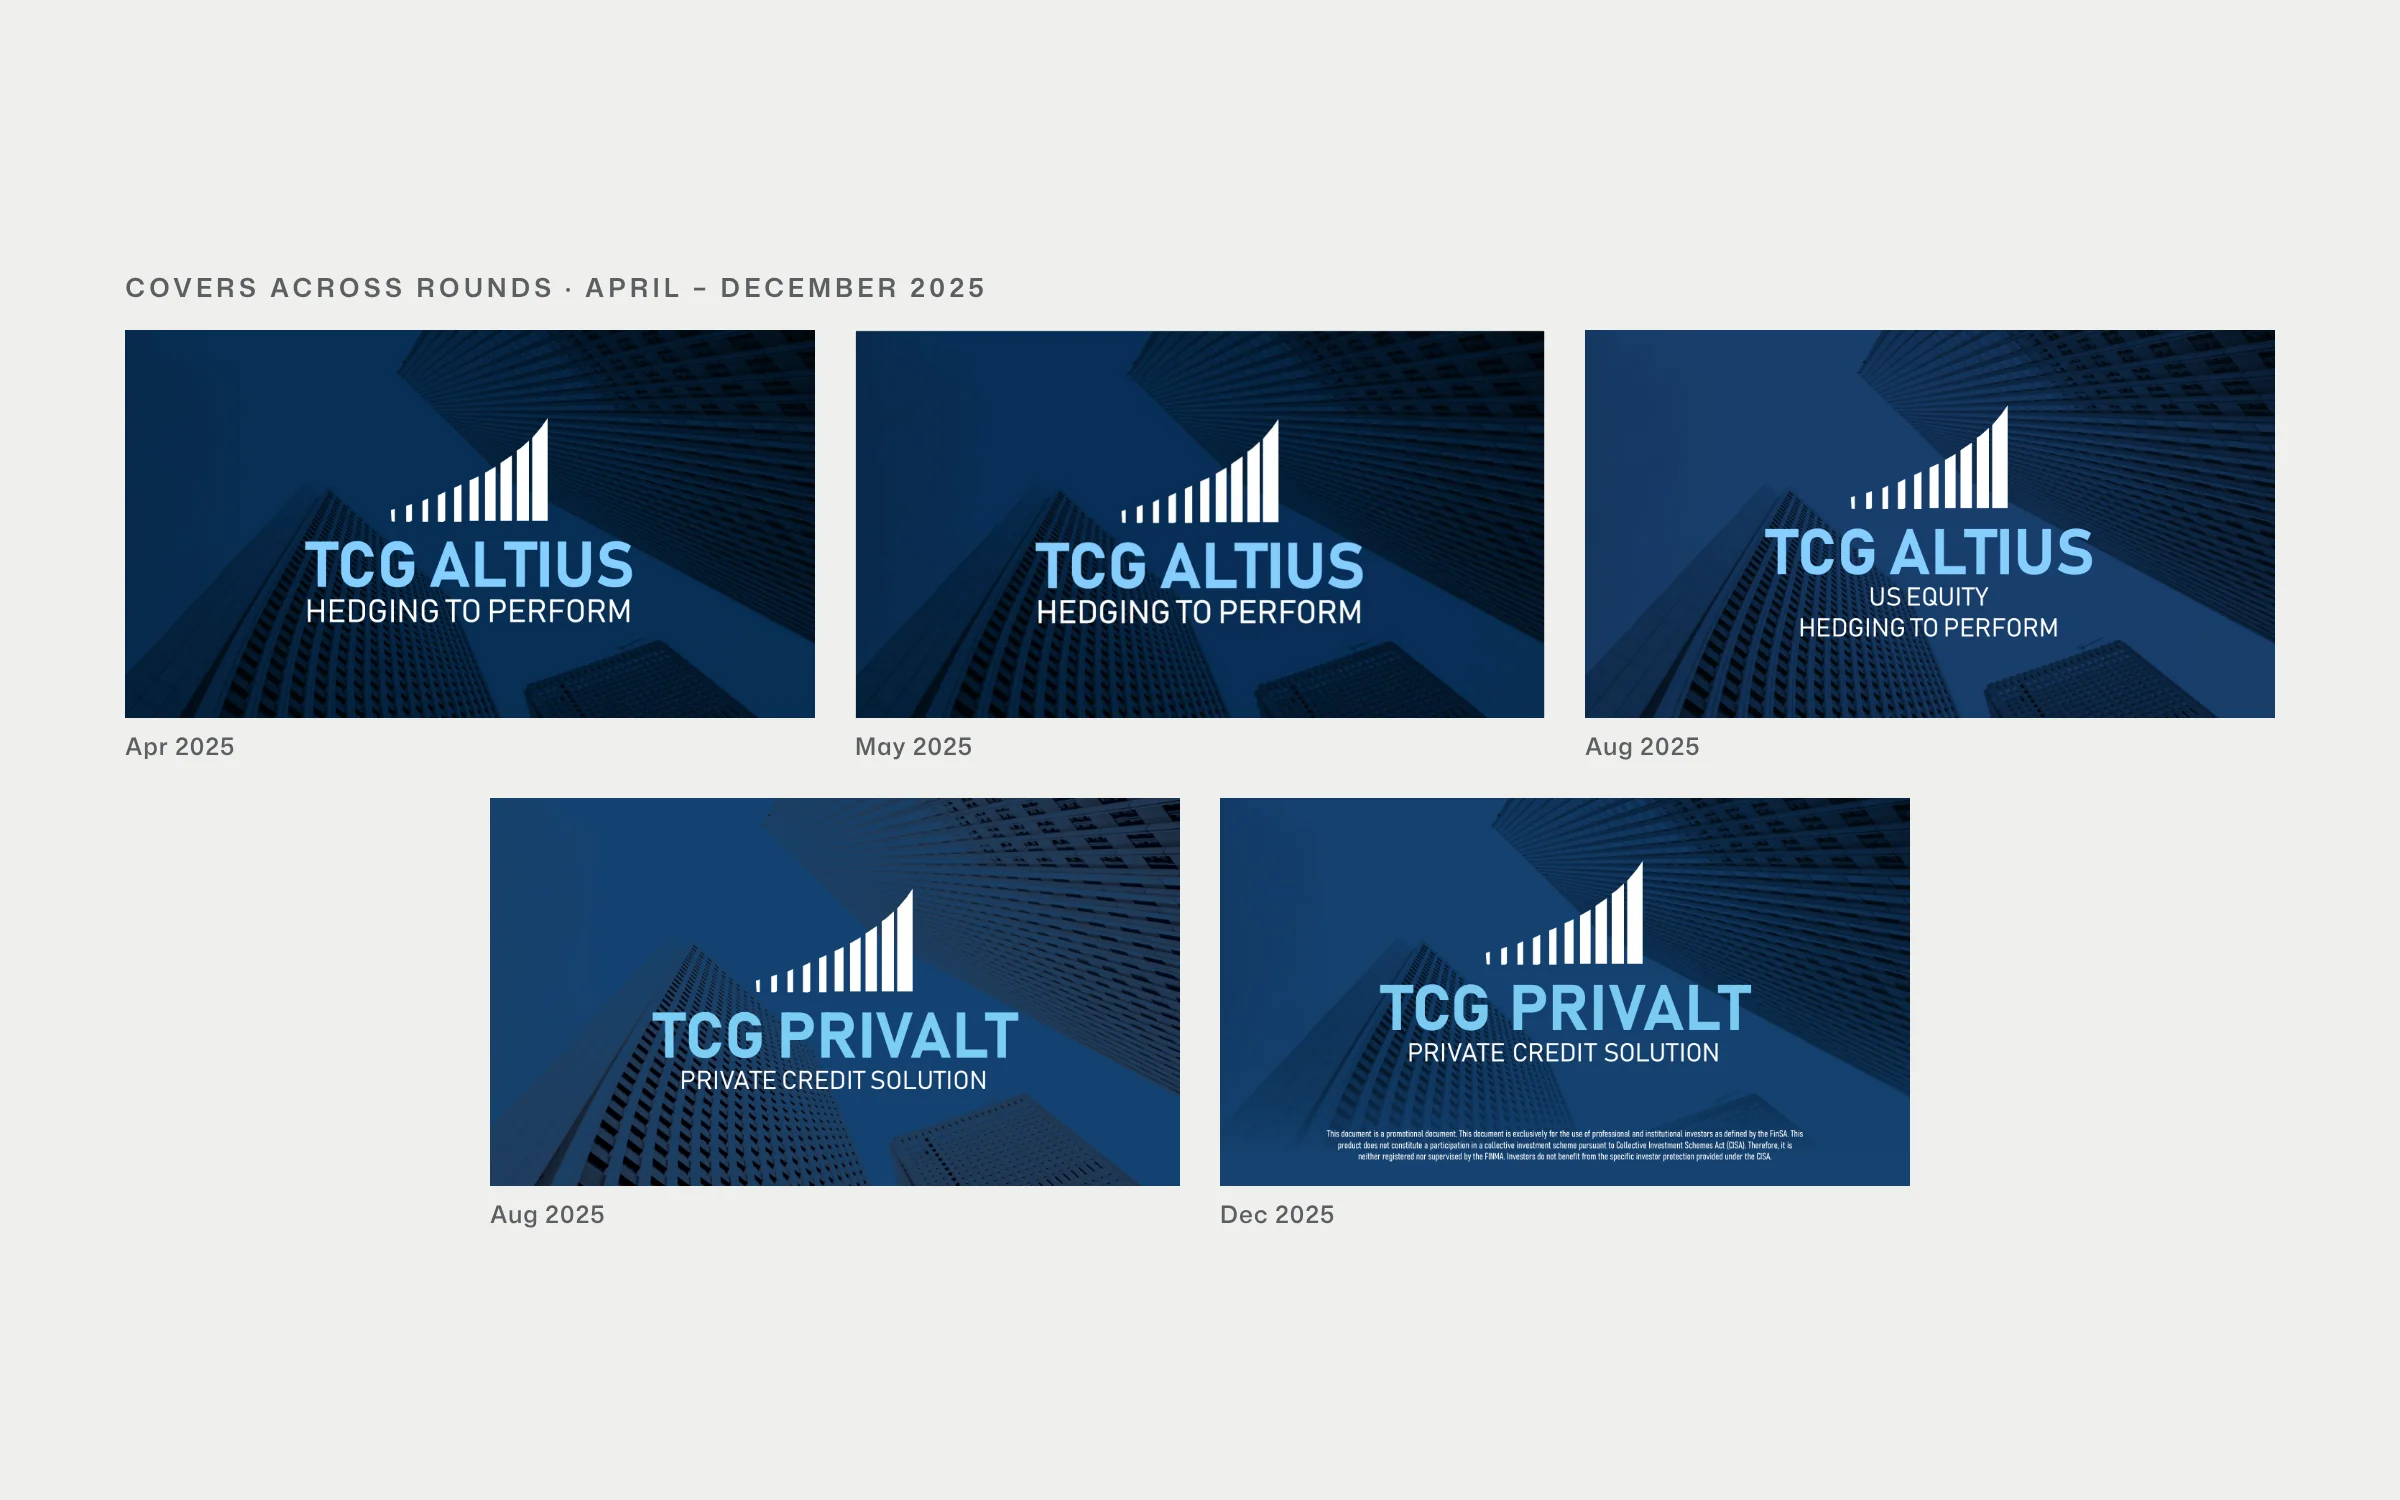
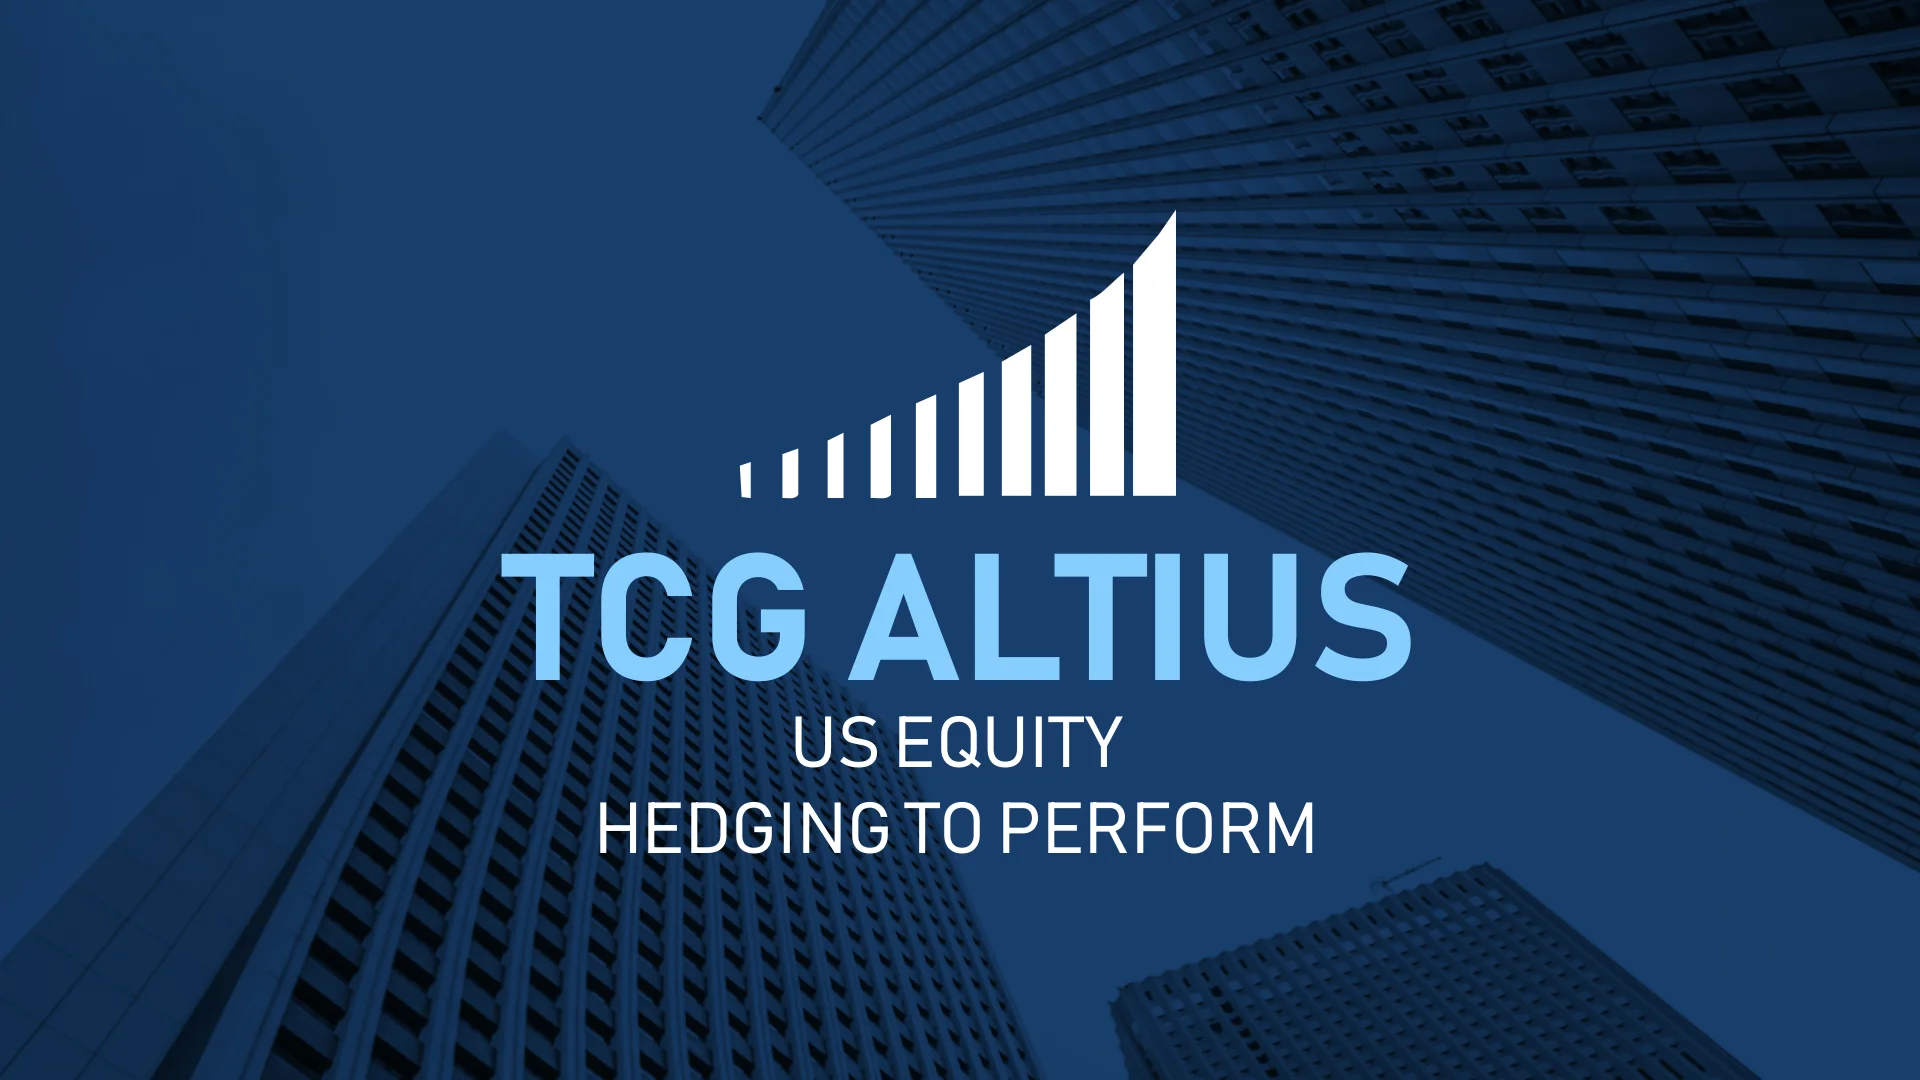
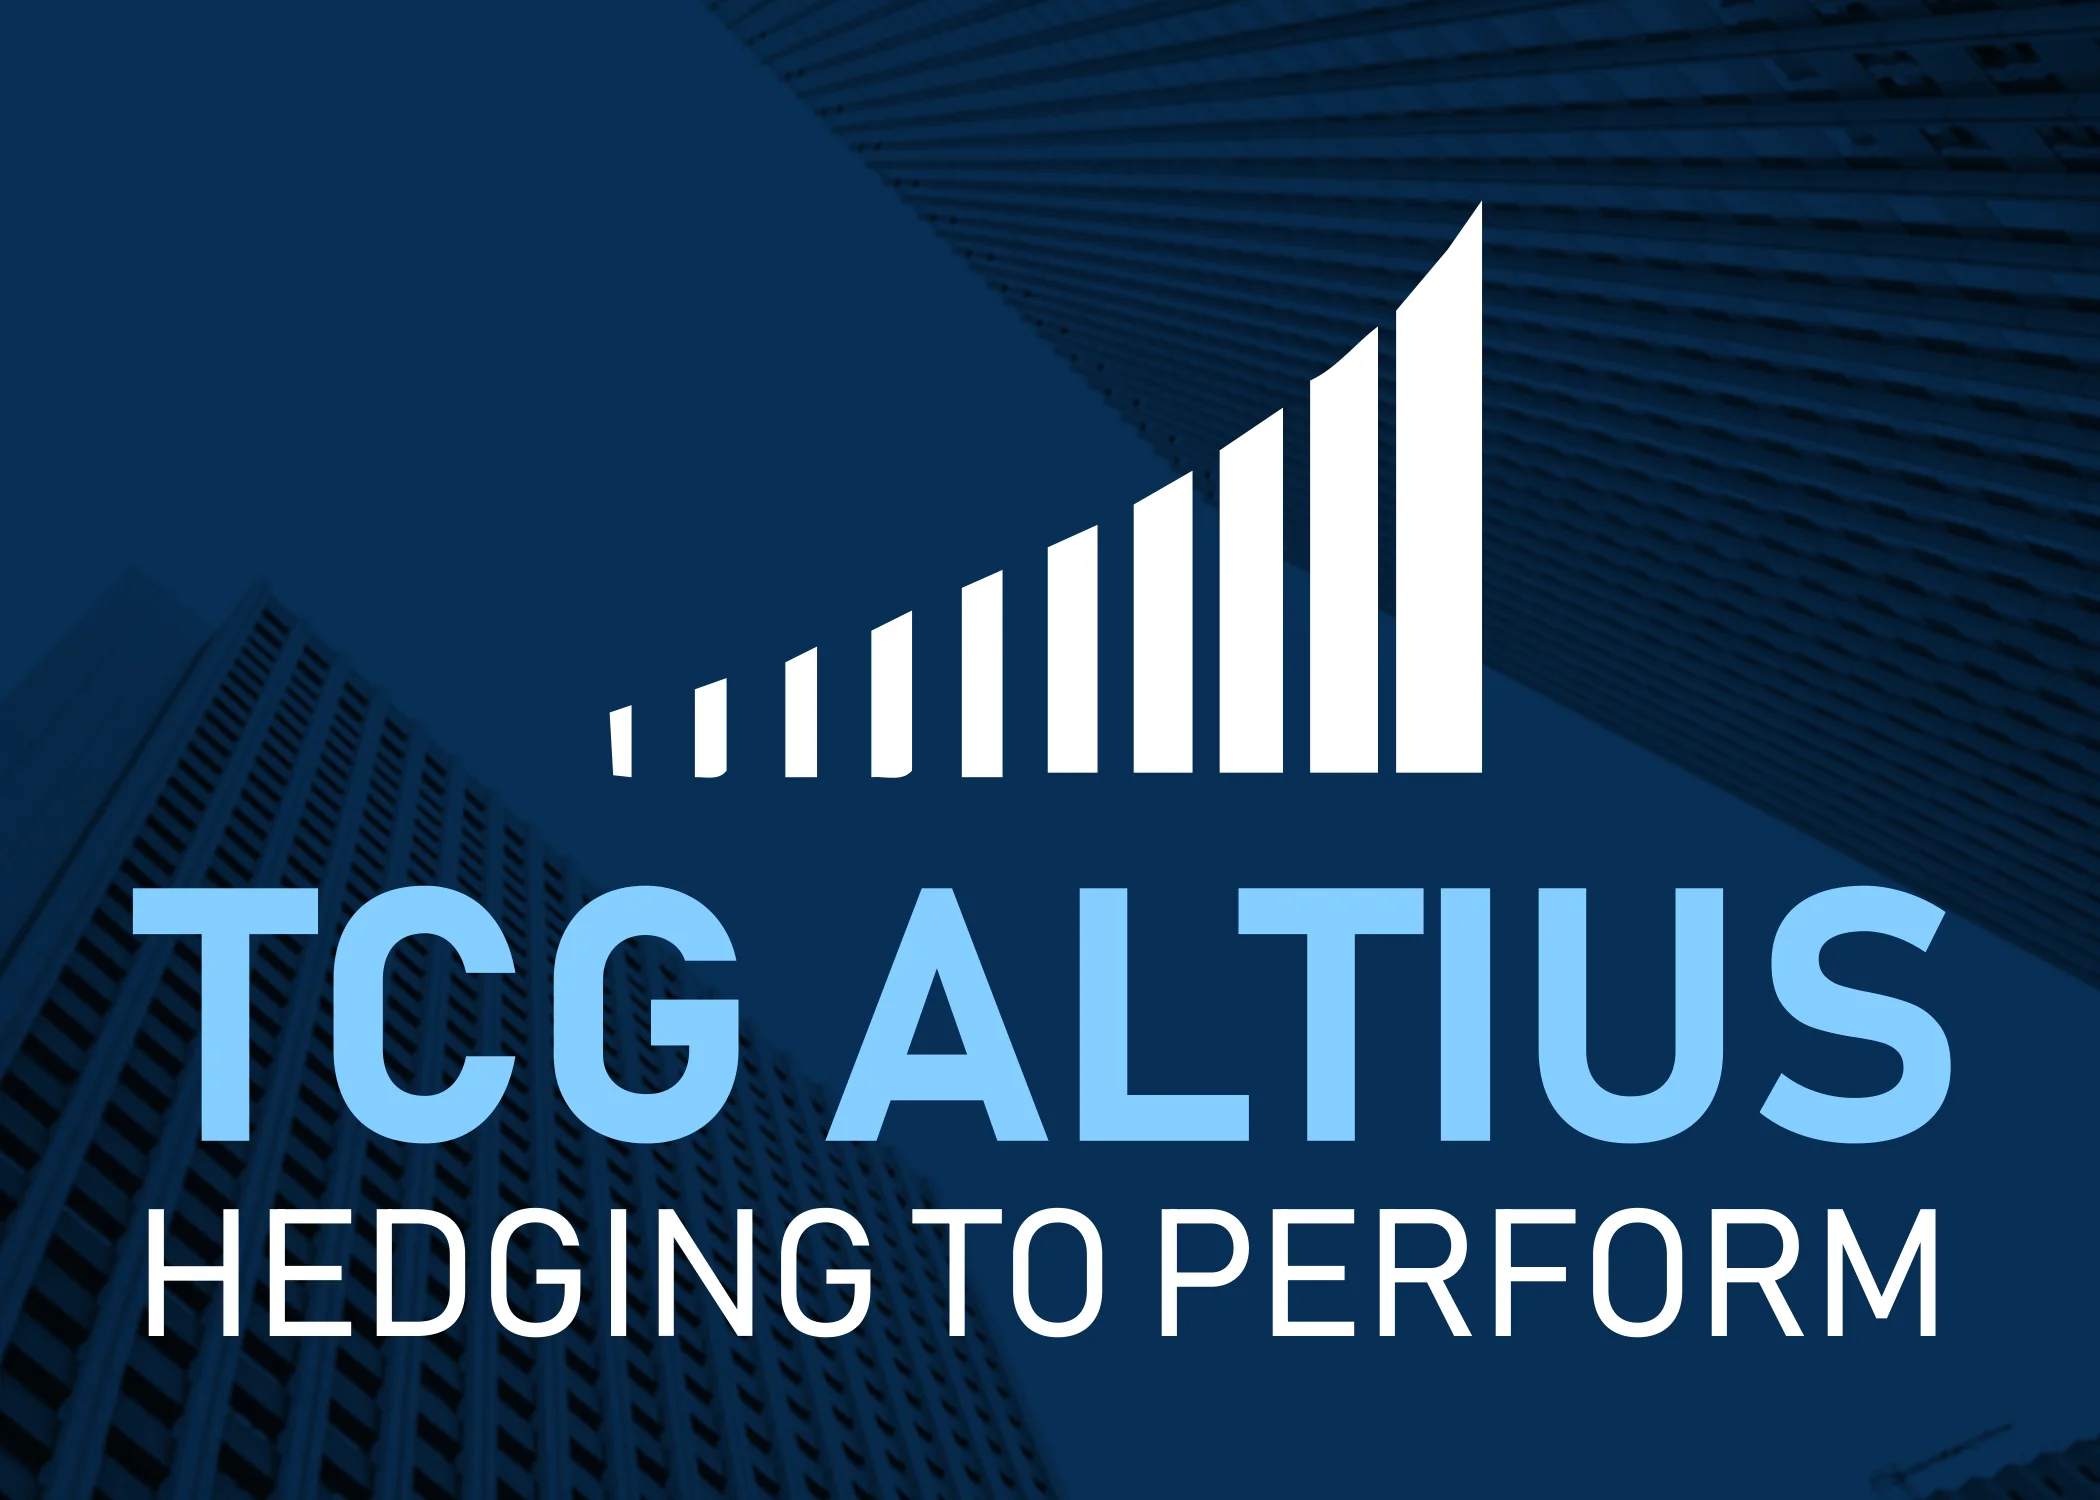
Condensed type family, architectural photography and a fixed chart language, applied to every presentation the firm uses.
Covers across rounds, April to December 2025
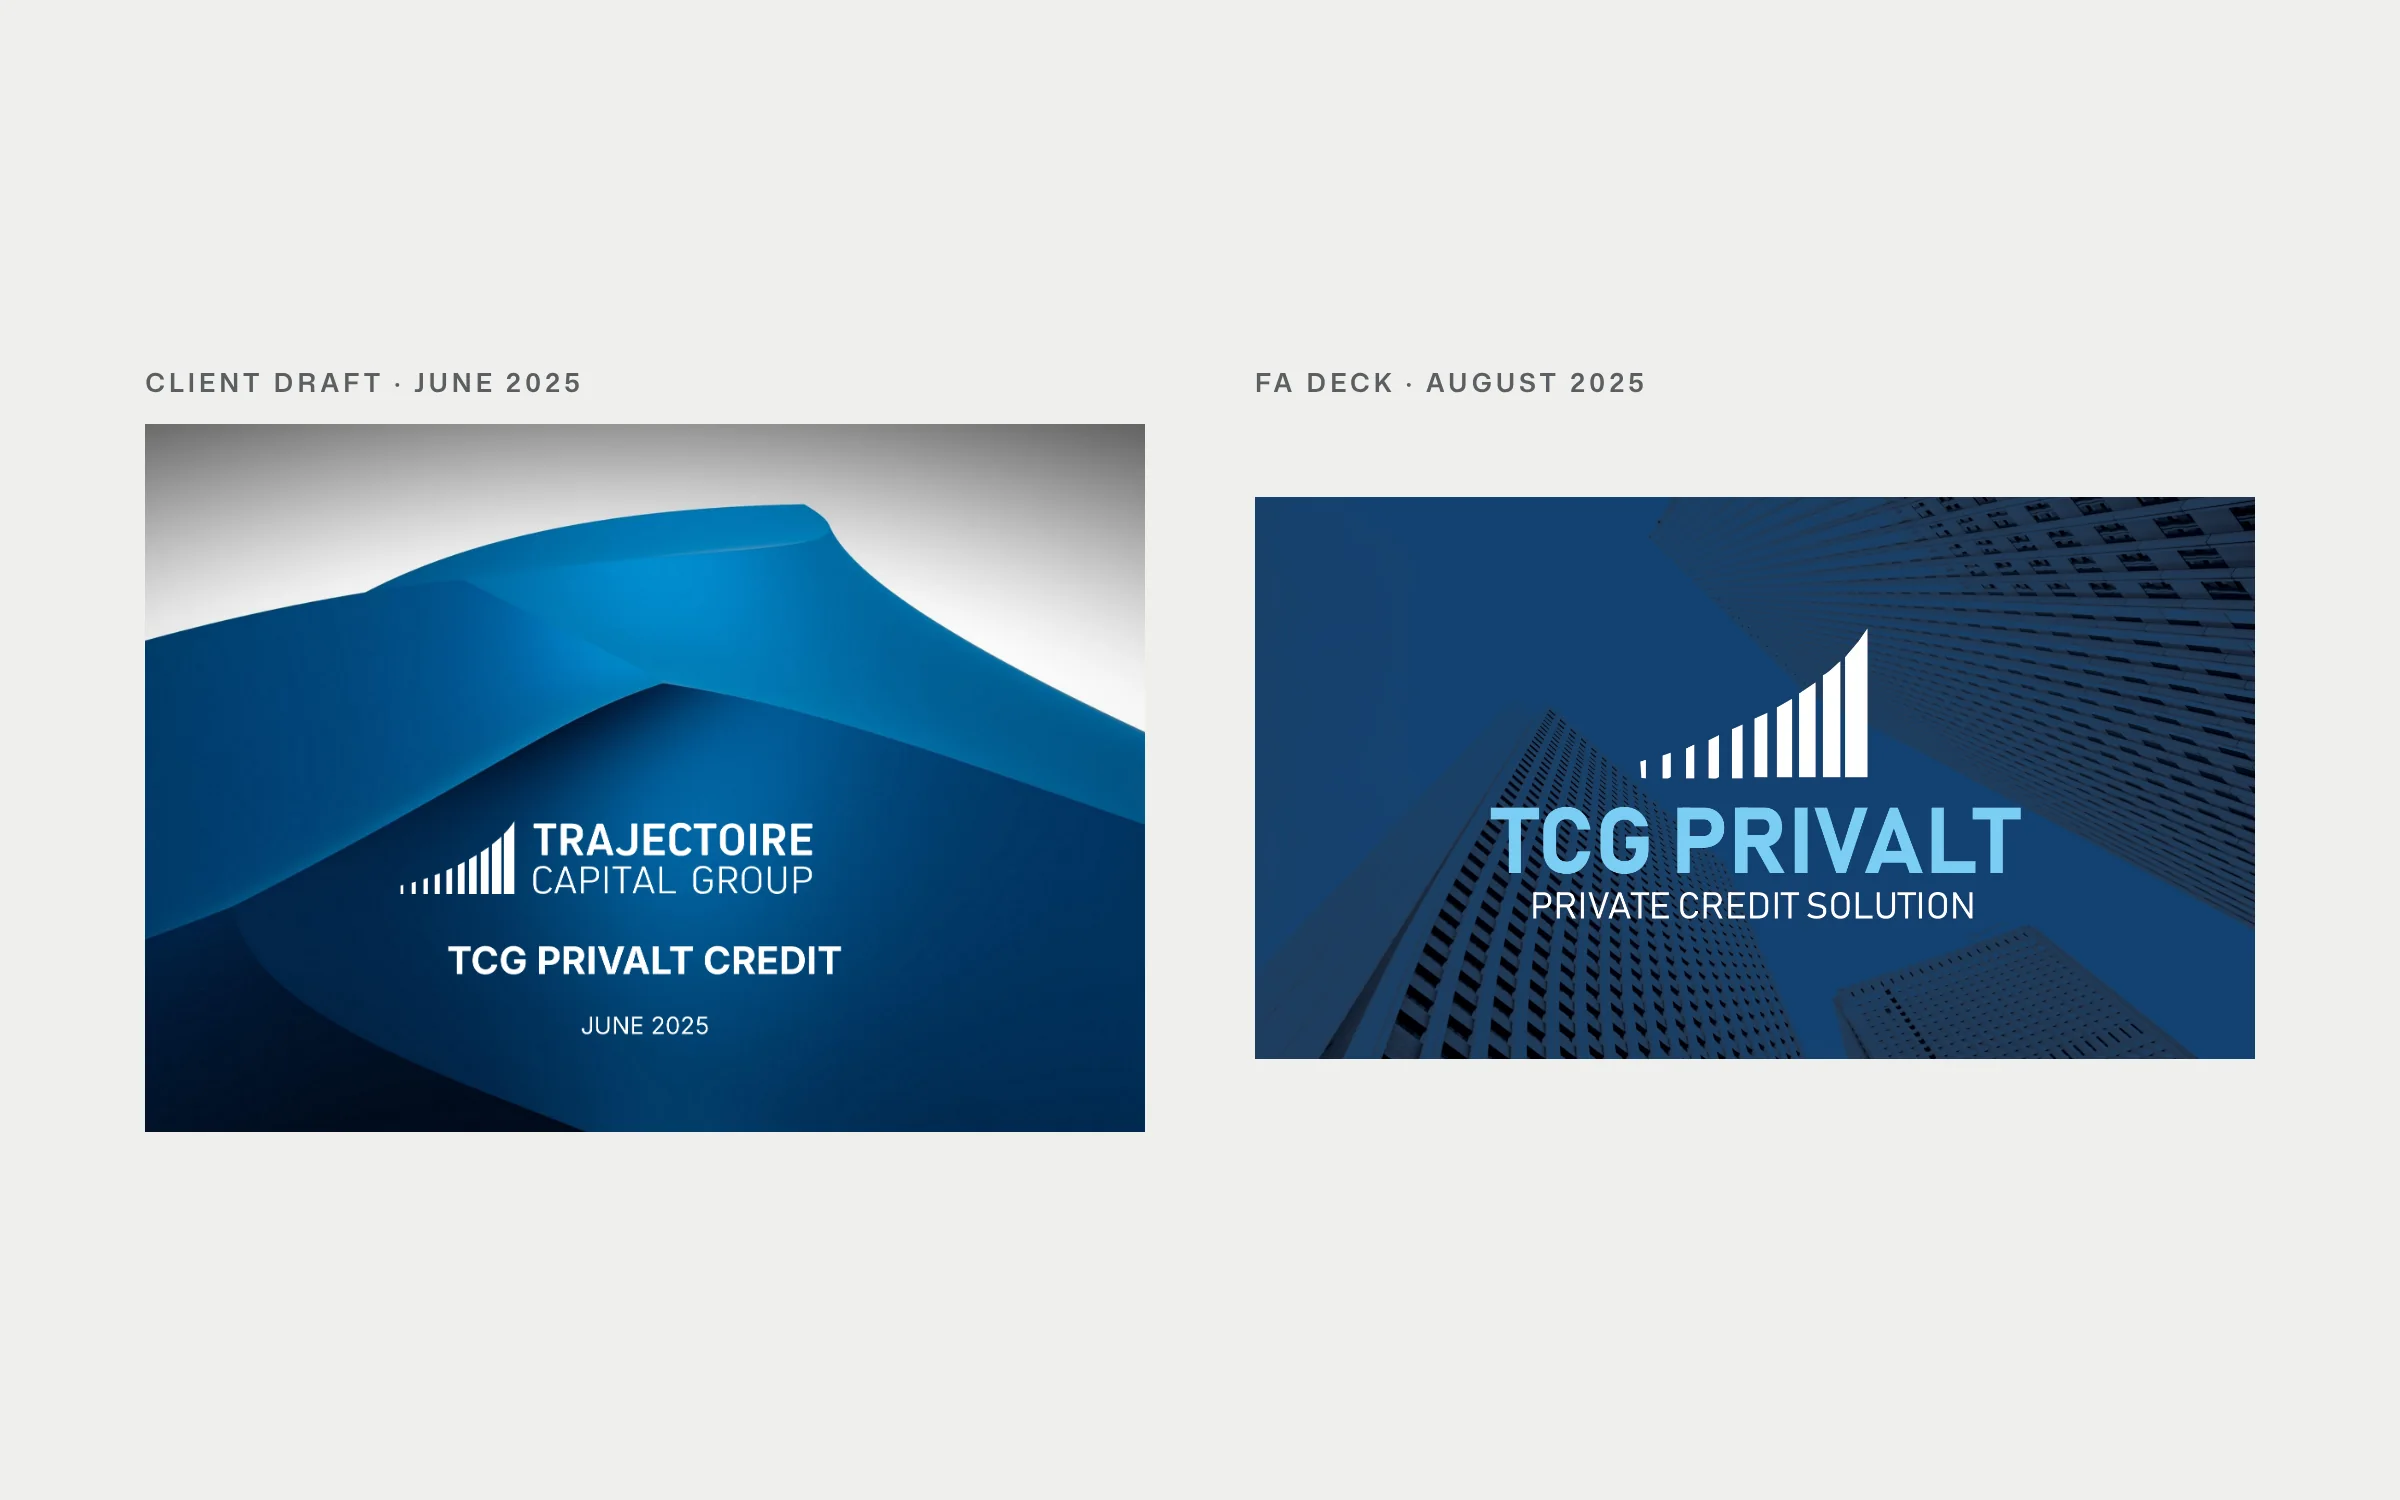
Deliver — Draft in, deck out
Each round arrived as a client PowerPoint and left as a designed deck, in full and compressed versions for distribution.
Update rounds, February 2025 to March 2026


Results
What it added up to.
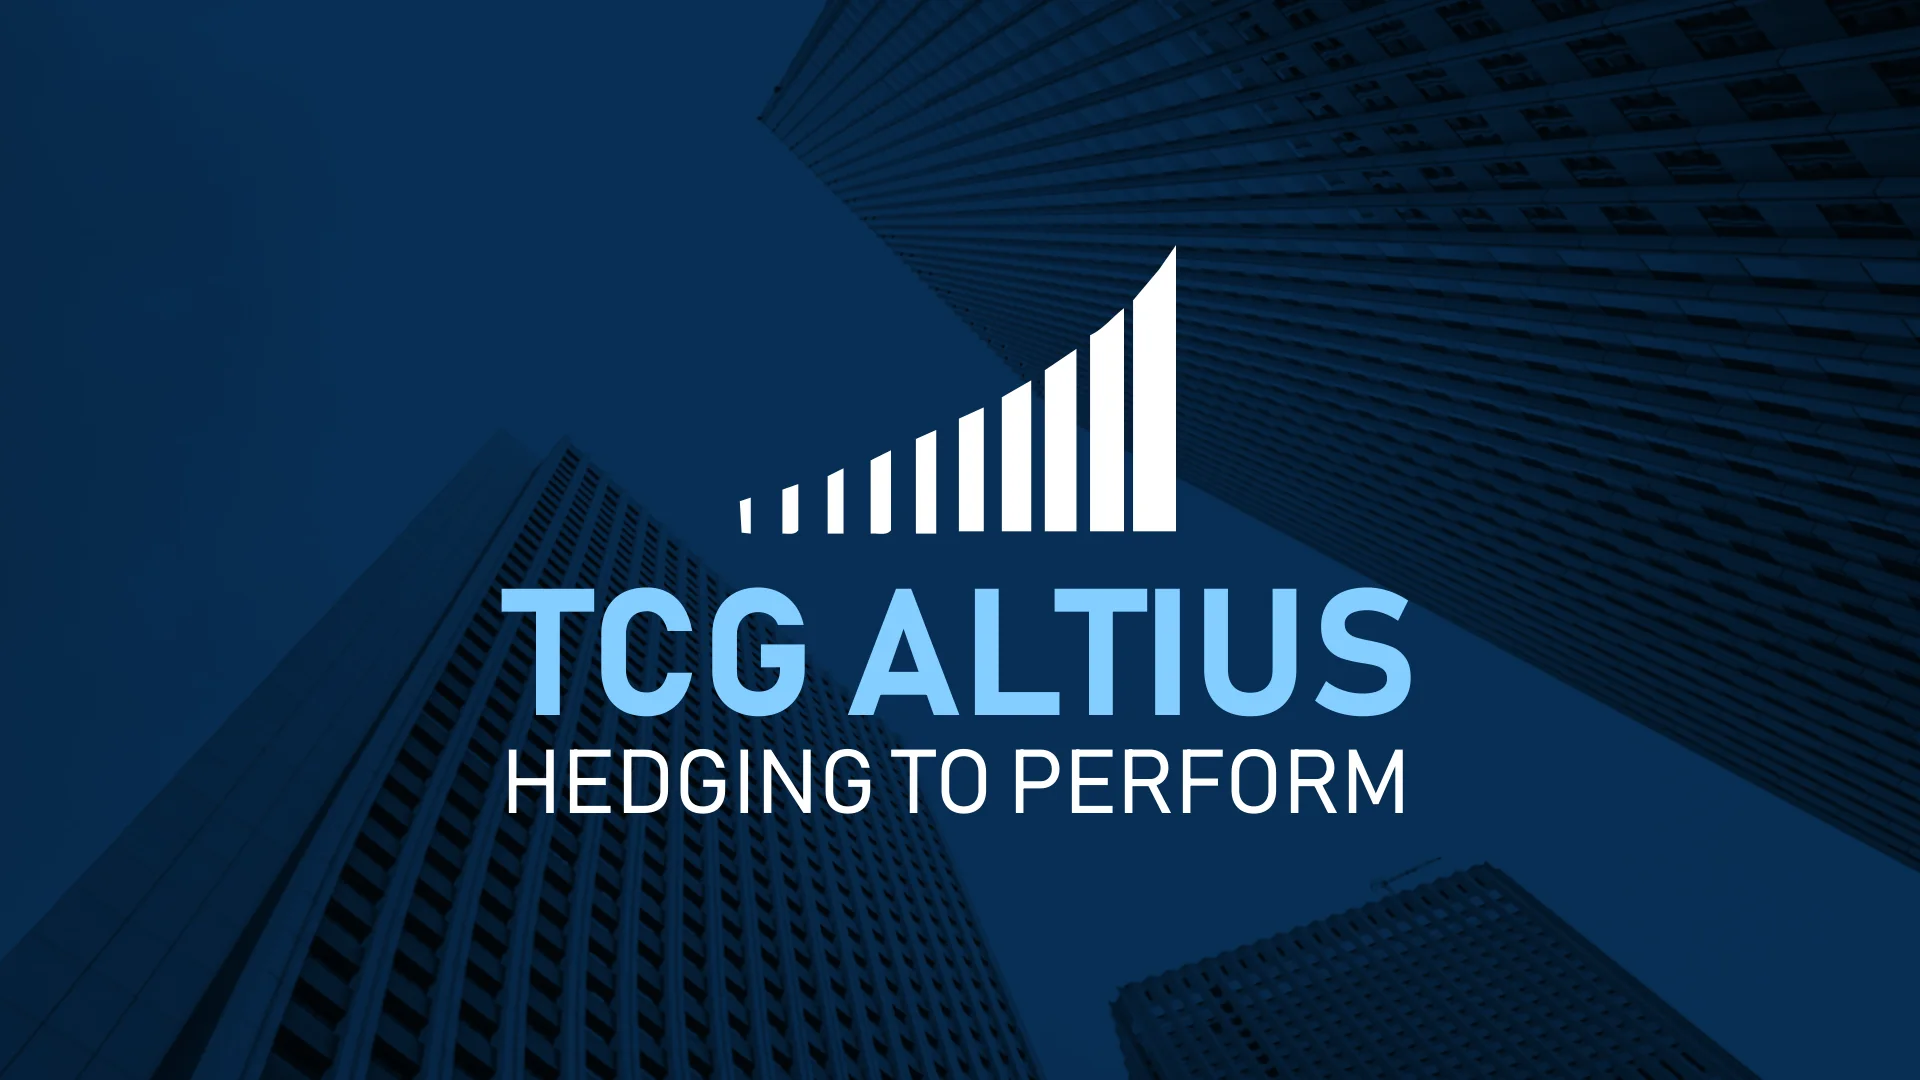
Through more than a year of updates, from February 2025 to March 2026, the firm's presentations stayed visually consistent while the content kept changing. Every new data set was redrawn into the same chart language, so an investor sees one firm, whichever deck lands in their inbox.
The outcome
What the work changed.
Through more than a year of updates, from February 2025 to March 2026, the firm's presentations stayed visually consistent while the content kept changing. Every new data set was redrawn into the same chart language, so an investor sees one firm, whichever deck lands in their inbox.
A note from Alex
Alex Codreanu
Founder and design lead
What the client said
Credits
FA Studios: presentation design system, data visualisation, ongoing deck updates.
Related work.
More work in this field, then projects with the same services.






































































Want a project like this one?
Tell us what you’re building. You’ll hear back within one business day.
Prefer email? contact@fastudios.co